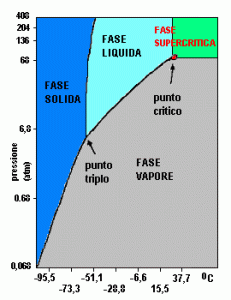
The adjective supercritical defines any chemical compound, or mixture of compounds, which has reached its critical point (Pc). Usually pure substances are used, as they are easier to manage and monitor. In order to understand this aspect, the phase diagram can help us. With this tool it is possible to understand how, with changes in pressure (P) and temperature (T), the state of matter can change. In addition to the solid, liquid and gaseous states, more universally known, there is also the supercritical state, which occurs when certain values of P and T are reached, called Critical Pressure (Pc) and Critical Temperature (Tc). This diagram is composed and divided by some curves and areas that denote some peculiar characteristics of the substance in question such as:
- Regions of the diagram: areas delimited by some curves in which the different aggregation states of the chemical examined are identified.
- Curves of the diagram: curves consisting of all those point values given by the correspondence of T on the abscissa axis and P on that of the ordinates, in which at least 2 different phases coexist simultaneously, are called state transition curves and are substantially 3 :
– Sublimation / Frosting: indicates the coexistence of the solid and gas phase. By slightly deviating from these values, the complete passage of matter from the solid to the gaseous state occurs (Sublimation) and vice versa (Frosting).
– Melting / Solidification: indicates the coexistence of the solid and liquid phase. By slightly deviating from these values, the complete passage of the material from the solid state to the liquid one (Melting) and vice versa (Solidification) takes place.
– Vaporization / Condensation: indicates the coexistence of the gas and liquid phase. By slightly deviating from these values, the complete passage of the material from the gaseous to the liquid state (condensation) and vice versa (vaporization) occurs.
- Triple Point: identifies the point where the three solid, liquid and gaseous phases coexist.
- Critical Point: identifies the point where the liquid / gas curve ends, at these conditions Tc and Pc are reached for which the two phases are indistinguishable as they have the same density.
- Supercritical phase: this region of the diagram has no boundaries marked by phase curves like the others, but is arbitrarily indicated when the values of Pc and Tc are exceeded. In this phase the substance has typical mixed properties of both liquids and gases.
As far as CO2 is concerned, the supercritical phase can be achieved with a relatively low energy expenditure, as the Pc is characterized by Tc equal to 31 ° C and Pc equal to 73.8 bar.